Large scale parameterized reports with Python and Quarto - A business case
A solution over large scale productionized and parameterized automated reporting business needs when dashboarding is no more a solution
August 20, 2024
Introduction: Moving Beyond Dashboard Dependency
In many large corporations, dashboards are the go-to tools for tracking key metrics, whether it’s through Tableau, Power BI, or similar dashboarding platforms. While always effective for smaller businesses, the sheer scale of operations at larger corporations can turn these tools into a headache depending on the application. The sole reliance on dashboards for every need can lead to inefficiencies, especially when the data needs to be repurposed for different reporting requirements. This is a challenge faced by many organizations, and it often becomes particularly evident in the context of performance reporting.
This blog post explores a potential solution implementation to automate and scale reporting with means other than dashboarding, focused on alleviating the burden of manual business presentation preparation that depends on data from dashboards.
When Dashboards are not the solution
One significant challenge I encountered during my time working at bigger scaled companies, was redifining reporting needs that could not rely on dashboards. Most analytical teams manage several dashboards that serve a wide range of daily reporting needs, providing various insights into campaign and other performance metrics.
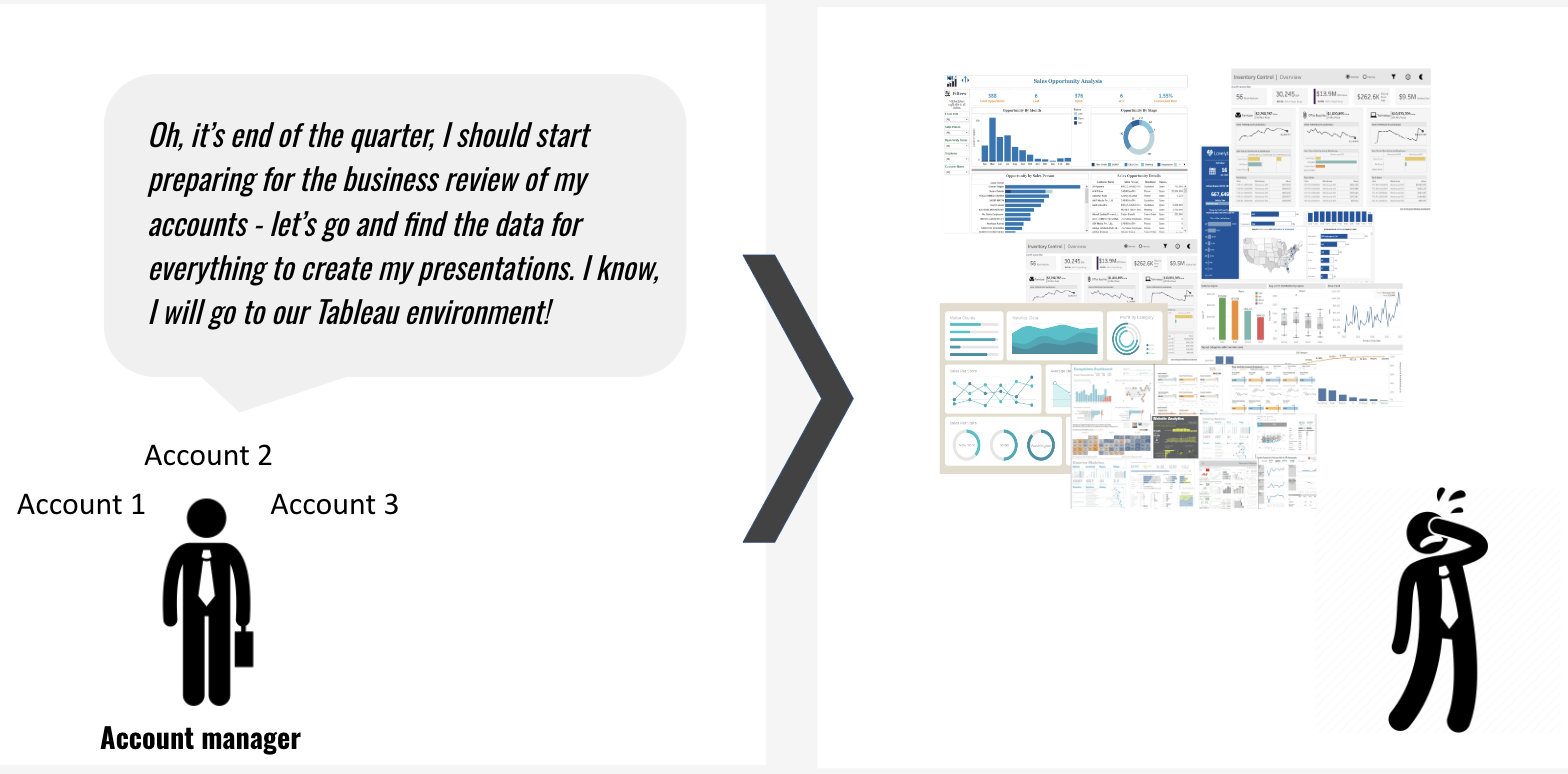
For example, in ecommerce and retail media companies, account managers, who can be in direct contact with advertisers, often need to create business reviews and presentations which derive their data from various dashboards. Additionally, they can be responsible for recurring presentations, such as quarterly business reviews, where they might present detailed performance insights in PowerPoint like formats to each account and advertiser they manage.
While this approach works in theory, the manual nature of extracting data from multiple dashboards and then consolidating them into a cohesive presentation can introduce several inefficiencies. It is a time-consuming, error-prone process that ultimately limits the number of accounts who can receive business reviews. Moreover, the lack of a unified reporting format can lead to inconsistencies in the presentation style and content across different accounts.
The Problem: Manual Inefficiencies
Taking the example of media account managers into account for this post, they can be responsible for creating detailed account performance presentations for advertisers, often on demand or for recurring quarterly business reviews. This process heavily relies on navigating multiple dashboards to gather the necessary data. However, this approach presents several challenges:
Extremely Time-Consuming Data Collection: There is a need to sift through multiple dashboards to retrieve the necessary data, which consumes valuable time that could be better spent on analysis and strategy.
Prone to Manual Errors: The manual nature of data extraction and consolidation from these dashboards increases the risk of errors, such as selecting incorrect date ranges, pulling data from the wrong dashboard, or miscalculating metrics.
Low Job Satisfaction: The repetitive and time-intensive task of data collection detracts from employees core responsibilities, leading to frustration and disengagement.
Lack of a Unified Approach: Different employees often use different styles and formats for their reports, resulting in inconsistencies across presentations.
Limited Capacity: Due to the labor-intensive nature of the process, only a limited number of accounts end up receiving customized reviews.
Overwhelming Amount of Dashboards: As the number of dashboards grows, it becomes increasingly difficult to manage and find relevant data, leading to confusion and inefficiencies.
These challenges highlighted the need for a more efficient, standardized, and scalable reporting solution.
Why Not a Single Dashboard?
At first glance, consolidating all the data into a single comprehensive dashboard might seem like a viable solution in such cases. However, this approach poses several problems:
Scalability Issues: A single dashboard with all the necessary information can become overloaded, making it difficult to filter and retrieve specific data efficiently.
Performance Limitations: With large datasets, the dashboard can become slow and unwieldy, further complicating the reporting process.
Branding and Visual Constraints: Dashboards have inherent limitations when it comes to custom styling and maintaining consistent visual branding across reports.
Overcomplicated Navigation: A single dashboard with all the data could require extensive filtering and customization, making it difficult for users to quickly find the specific information they need.
Limited Interactivity and Customization: Dashboards might not provide the level of customization needed for individual reports, especially when personalized insights are required.
The Solution: Automating and Scaling Custom Reports
When looking at all the aforementioned points, one can see an opportunity to automate and streamline this workflow with different tooling that can facilitate the process. The primary goal is to eliminate the time-consuming and error-prone tasks that account managers can face, particularly when navigating through numerous dashboards to gather data for their business reviews.
After exploring various options, a parameterized reporting system seems like an ideal option to automate the entire process. This solution can remove the need for account managers to manually extract data, create visuals in Excel, and consolidate everything into PowerPoint presentations. Instead, the new workflow automates: data collection, visualization, and report generation, allowing to produce consistent and accurate reports for hundreds of accounts with minimal human intervention.
Technical Implementation Steps
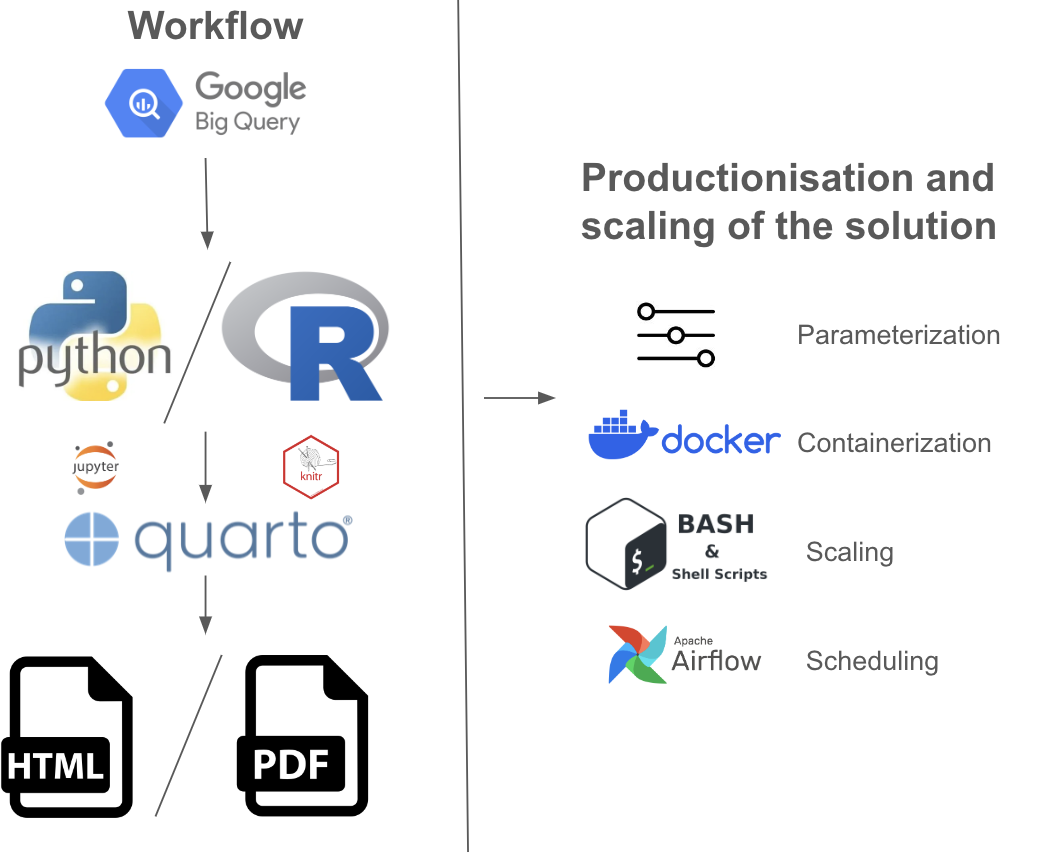
The core of the solution presented in this post is a script, written in Python (or R), that orchestrates the entire workflow. Below is a breakdown of the key components:
1. Parameterized Reporting with Quarto:
Quarto, an open-source publishing system, is used to generate reports. Quarto files (.qmd) combine code and markdown, similar to Jupyter notebooks but with enhanced capabilities for report generation. This system allows for the dynamic generation of reports based on input parameters, such as the account name and the specific time period.
The YAML header in the Quarto file defines the main configuration, including parameters for the account and time period. These parameters are crucial for customizing the report for each account.
| |
While in R the parameters are set inside the YAML portion, in Python, the parameters are passed directly under the YAML configuration to dynamically adjust the report generation process:
| |
2. Data Retrieval from BigQuery:
The script retrieves data from Google BigQuery, aggregating and manipulating the data from multiple sources which are also used in numerous dashboards. Individual SQL files were created for each data query, which the script dynamically modifies using the input parameters (e.g., account and time period).
For example, here’s how the SQL files can be loaded and executed in Python using bigquery from google.cloud client:
| |
The R equivalent uses the bigrquery package utilizing the BigQuery API to authenticate and execute queries:
| |
This ensures that each time the report runs, BigQuery executes the SQL scripts for the correct account and time period by passing the parameters inside the SQL files using brackets e.g. {yearQuarter}.
3. Report Generation and Visualization:
Once the data are retrieved, the script processes them and generates visuals and tables directly within the Quarto document. This step consolidates all the necessary information into a single, neatly formatted HTML report for each account. The report is interactive and includes all the visuals and insights needed for a business review.
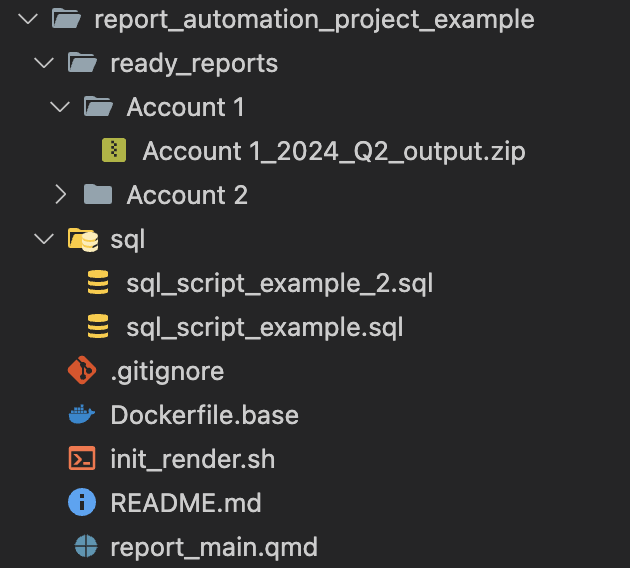
A basic example structure of the project in VScode and how to structure it with the main elements could look as follows:
4. Automation with Shell Script
To scale the solution and handle hundreds of accounts, the report generation process can be automated with a shell or bash script. This script loops through a list of accounts and time periods, executing the Quarto report for each combination. The generated reports can be saved in designated folders, and any related Excel files can be also organized for easy access.
Here’s an example of a shell script that manages the automation:
| |
This script can be executed manually or scheduled through an Airflow DAG or Cron job, ensuring that reports are generated at regular intervals without manual intervention.
The solution can transform a labor-intensive, manual process into an efficient, automated workflow. By using Quarto for dynamic report generation, BigQuery for data retrieval, and shell scripts for automation, an end-to-end workflow system is created that scales effortlessly across hundreds of accounts.
For a visual example of what the final HTML report can look like, you can download a simplified version here., this can be extended as much as one wants with more information, text, graphs and tables.
Business Impact: Transforming Reporting at Scale
The implementation of such an automated reporting workflow can have a significant impact on the efficiency of providing business reviews:
Eliminated Time-Consuming Data Collection: There is no longer the need to spend hours manually gathering data from numerous dashboards. The automated workflow prepares everything in one place for each account.
Reduced Errors: Automation removes the risk of manual errors, such as selecting incorrect periods or making wrong calculations.
Improved Job Satisfaction: By automating the repetitive and manual aspects, employees can focus on their core responsibilities, leading to higher job satisfaction.
Unified Reporting Style: The workflow ensures that all reports adhere to a consistent style and branding, eliminating discrepancies between different account managers’ presentations.
Conclusion
This project highlights how automation can effectively resolve common challenges in large-scale reporting where dashboarding is no longer the solution. By developing a parameterized reporting workflow, the reporting process can become more efficient, consistent, and less prone to errors when consolidating a large amount of information.
It’s important to note that every business problem is unique, and solutions need to be tailored to fit the specific context and requirements. While this approach can work well for some reporting needs, similar strategies should be adapted based on the distinct challenges and goals of different teams and organizations.
Any solution is always unique to the problem and the circumstances that surround it!
If you’re interested in exploring more about how to communicate your data effectively, especially through visuals, you might find my other post on effective data visualization practices helpful. It covers key principles and offers practical examples on how to design clear and impactful charts, which can greatly enhance data storytelling. You can check it out by clicking here!
For attribution, please cite this work as:
Large scale parameterized reports with Python and Quarto - A business case.
Michalis Zouvelos. August 20, 2024.
mzouvelos.github.io/blog/productionized-parameterized-automated-reporting
Licence: creativecommons.org/licenses/by/4.0